ASSESSING productivity in a beef herd can be done using a range of different metrics.
In many cases producers focus on some obvious measures. The most common revolve around pregnancy (or conception) rates, marking (branding) and weaning rates. These are commonly expressed as percentage against the number of cows in a herd.
 However, these rates can also be somewhat misleading. Unless the rates are calculated against the total number of cows joined, the pregnancy rate or the weaning rate, there is a risk that issues associated with fertility can be overlooked.
It isn’t uncommon for producers to calculate pregnancy rate against cows joined, but their weaning rates against the number of pregnant cows. The result are two different numbers that can create confusion or not contribute to meaningful herd improvement decisions.
While these rates are useful indicators, they may not actually be as helpful in making improvements as many producers would imagine. In conversation with Queensland beef production scientist Dr Geoffry Fordyce several years ago, I was reminded that “producers don’t get paid on percentages. They get paid on kilograms of beef they sell.”
This is a sentiment that is often overlooked by many breeders and producers, who are focussing only on percentages as their measure of production.
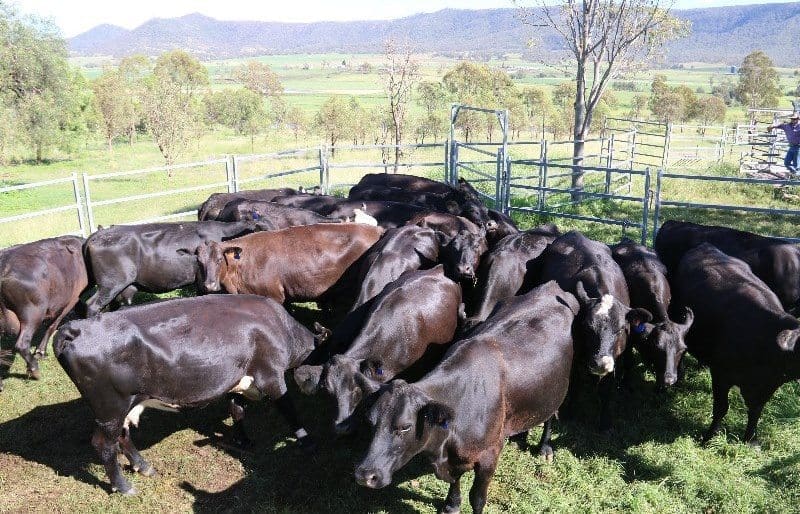
It is not unreasonable to suggest that there is significant variation in most cow herds. This variation is often most seen in the range of mature weight, frame size and body condition.
This variation can be significant. It isn’t unusual to see a range of up to 180kg across a cow herd. This variation poses significant challenges to any breeding program or for future genetic selection decisions.
As an example, using a 250-cow herd with a range in liveweight from of 500-680kg, the spread of cattle across this range has some significant implications for feed intake on a daily dry matter basis (click on image below for a larger view).
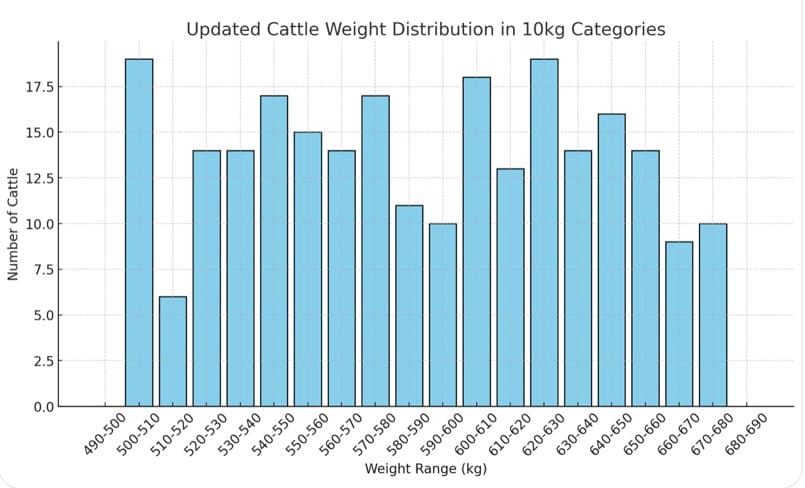
Using this spread and assuming a Dry Matter Intake of 3pc liveweight, the range extends from a low of 15kg/day (for the lightest cows) to a high of 20.4kg/day (for the heaviest). The average across the herd would be 17.7 kg/day.
Over time, or if the weight range within a herd continue to spread, the difference in intake at the higher level can start to see lost production opportunities by restricting the number of cows that could be included in the program.
Producers often overlook this issue, particularly if they are using percentages measures as their indicators of productivity. It is not that unusual for a large cow to be forgiven her size and weight, if she is in calf, and rears that calf to weaning.
However, what has not been factored-in to these considerations are the issues firstly of how much feed does she need to achieve that result, and secondly how many kilograms of beef has she produced relative to her body weight?
This is where percentage measures alone can become less helpful. Producers are being paid on the kilograms of beef they produce. While having a live calf does add to that total, if the cow requires more feed to achieve that goal, then how efficient is that system? More tellingly, in difficult seasons, how marginal is that cow / calf unit in the overall program?
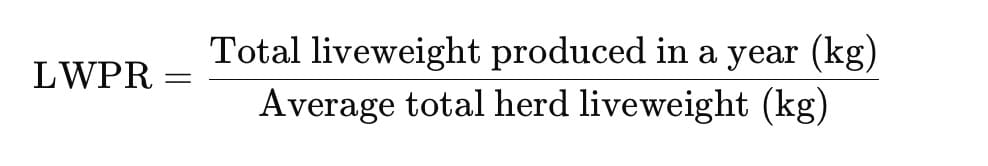
The long running Cash Cow project used a more complex, but effective method of determining cow productivity. The liveweight production ratio, calculates how efficiently a herd converts feed into saleable liveweight. While the calculation can be a complex one for individuals or for mobs in paddocks, it can also be a simple calculation for a herd.
In a simple herd calculation, liveweight production ratio (LWPR) is calculated by firstly calculating the total liveweight produced annually, and diving this by the average total herd liveweight.
For example: If a producer maintains an average herd liveweight of 200,000 kg over the year, the herd produces 60,000 kg of saleable liveweight (growth, weaners, cull animals, etc).
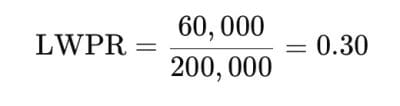
This means that for every kilogram of cattle in the herd, 0.30kg of new liveweight is produced per year.
As a general metric, LWPR adds more detail to other measures already in place. However, at this simplest level it still does not address the variation within a herd.
Producers who really want to understand their herd and select for more efficient producers would use the following calculation:
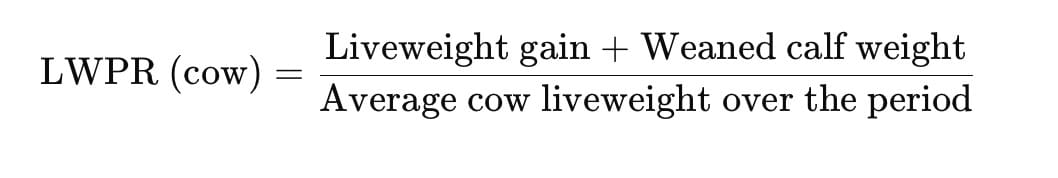
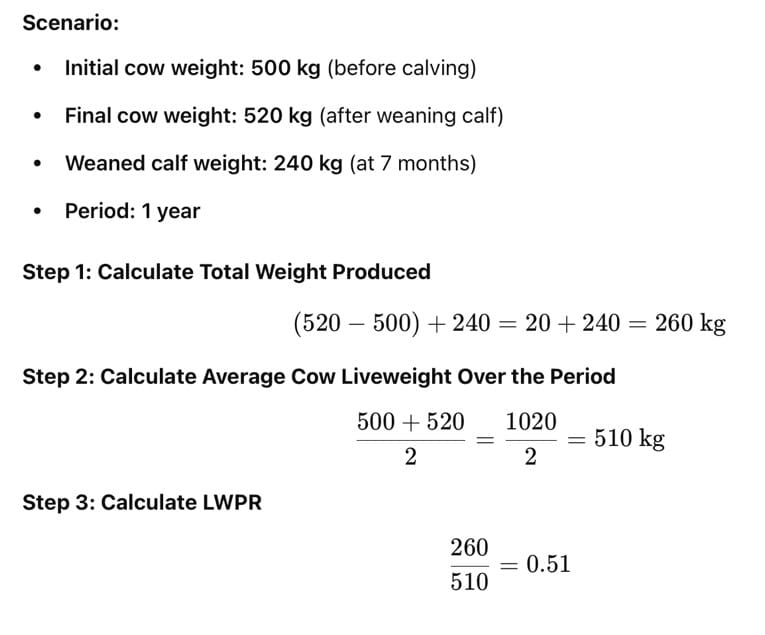
An example of this individual calculation is contained in the image below (click on image for a larger view). In this example the cow produced 0.51kg of liveweight per kg of its own bodyweight over the year.
The challenge for many producers is to weigh and record their cows as well as the weight of the weaners. However, while this is a challenge, it would quickly reveal not only the wide variation that exists within a herd, but also those cows that are consistently producing more kilograms of beef and directly contributing to a more profitable program.
From a selection perspective, it is easy to cull the non-pregnant females, or those that have poor temperament and structural or age concerns.
However, the forgiveness extended to big pregnant cows may be an issue holding back a herd. The data that LWPR offers, can help sort cows into a more efficient herd that will also be a more profitable herd.
 Alastair Rayner is the General Manager of Extension & Operations with Cibo Labs and Principal of RaynerAg. Alastair has over 28 years’ experience advising beef producers & graziers across Australia. He can be contacted here or through his website www.raynerag.com.au